July 22, 2021
Led by Cassandra Hradil (Price Lab, Penn Libraries), Elliot Montpelier (PhD candidate, Anthropology and South Asia Studies), and Deb Stewart (Penn Museum Library), this workshop explored some of the existing intersections between anthropology and the digital humanities, as well as opportunities for cross-pollination. The workshop incorporated several hands-on analog activities designed to get students thinking about how to conceptualize their data, how to visualize it, and how this work might shape or reshape their ethnographic outlook. The group then brainstormed how to link these non-digital activities to more digitally-oriented tools that graduate students can use to conduct research, to exhibit their data, and to craft compelling ethnographic narratives.
The workshop began by bringing in the work of visual designer Giorgia Lupi, whose "Data Humanism" manifesto deeply informs many of the workshop's topics:
Sketching with data — so, in a way, removing technology from the equation before bringing it back to finalize the design with digital tools — introduces novel ways of thinking, and leads to designs that are uniquely customized for the specific type of data problems we are working with. I draw to freely explore possibilities. (Giorgia Lupi, Data Humanism http://giorgialupi.com/data-humanism-my-manifesto-for-a-new-data-world)
The group then split into three different breakout rooms, each one exploring an analog technique for visualizing data that can be applied to anthropological work:
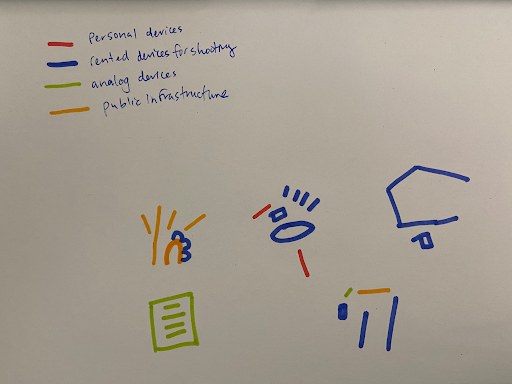
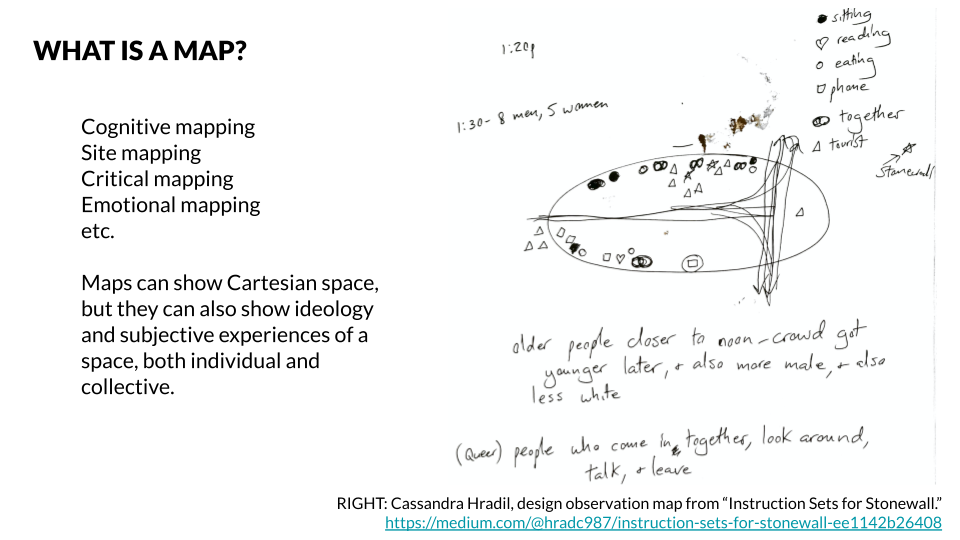
- Mapping: participants consider and draw how they or subjects in their ethnographic work move through public, or private spaces.
- Data Stories: a reflection on a series of moments or aspects from participants’ fieldwork/anthropological practice, or on some everyday data from the participants’ own life.
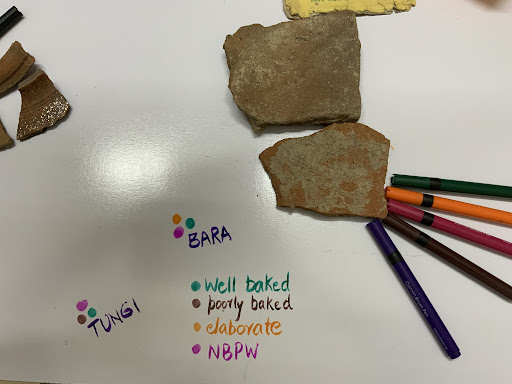
- Artifact analysis: a sorting/metadata/visualization exercise where participants extracted visual and other forms of information and data from their finite set of physical and/or digital objects.
After discussing some of the basic ideas behind each section, each group got into hands-on exercises that asked participants to visualize a dataset from their own anthropological practice. We shared these data drawings, with some interesting results.
Working in analog proved to be a refreshing contrast to the sleek flatness of our Zoom spaces, and it also inspired participants to look at digital work differently. Max Dugan, PhD candidate in Religious Studies, noted about the workshop,