D3 (Data Driven Documents) is an open source Javascript library that is widely used by data experts, creative technologists, and scholars to create and share many different kinds of data visualizations on the web. D3 is a “web-first” visualization library, making it a great tool for creating an interactive visualization that can be embedded in a larger digital project. This workshop introduced the basics of setting up a project and displaying a simple visualization with a small dataset, and included syntax and conventions that are useful to know for all visualizations in D3. Because this involves writing some Javascript, D3 is suitable for folks who have a bit of programming experience or are feeling adventurous about beginning to learn to code.
**Sample starter file: https://glitch.com/edit/#!/d3-basics-starter?path=script.js%3A1%3A0
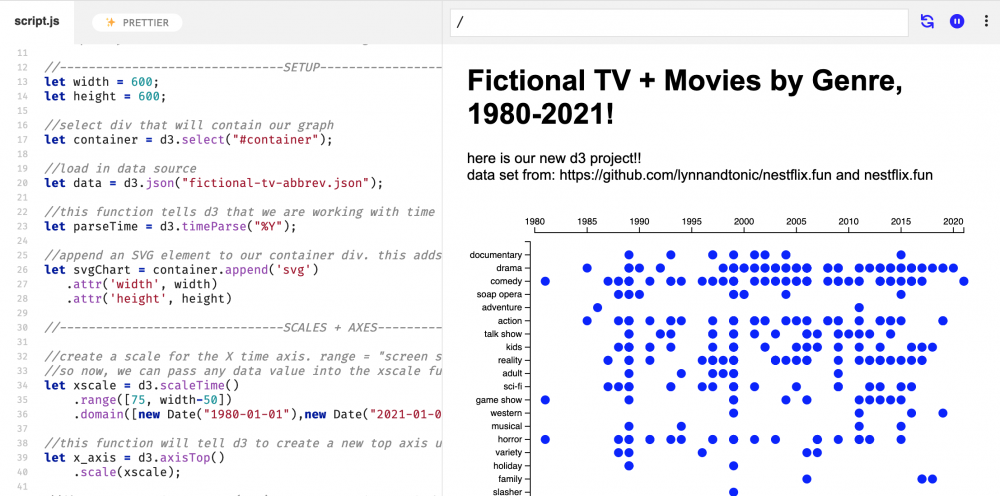
**Completed sample file: https://glitch.com/edit/#!/d3-basics?path=script.js%3A1%3A0
**Dataset: https://github.com/lynnandtonic/nestflix.fun
- Front end is at https://nestflix.fun/. Dataset + site built by Lynn Fisher (go check out her stuff!)
- Already pretty clean and well-structured; I’ve done a little bit of pruning to suit our exercise better
Notes on working in Javascript
let myVariable = “hello!”//dot notation can mean calling a method (special kind of function)
container.append('svg');
//dot notation can also mean accessing data from an object/JSON
console.log(info.title);
D3-specific syntax
let svgChart = container.append('svg').attr('width', 600).attr('height', 600)
//unlike JQuery, D3 often breaks that statement up with tabs so that we can better see what’s happening
  let svgChart = container.append('svg’)
    .attr('width', 600)
    .attr('height', 600)
Pros and Cons of d3
-
D3 gets easier the more you work with it
-
D3 is great for visual thinkers!
-
Once you’re used to it, it’s like painting with data
-
-
D3 gives you fine grained control over the look + functionality of visualizations
-
D3 supports many different kinds of visualizations
-
Because it starts with basic shapes, you can build almost anything you can imagine
-
-
D3 syntax is a bit different from regular Javascript
-
JQuery chain syntax
-
-
D3 doesn’t always scale well
-
In SVG mode, works well with hundreds of nodes/elements
-
In Canvas mode, can work well with thousands of nodes
-
For truly big visualizations, you need WebGL - which d3 can do, but it’s a very different process
-
-
D3 may be overkill for some use cases
To view the full workshop recording + see the exercise walkthrough, visit here.