I am excited to share this repository of Collections as Data notebooks at Penn Libraries! These notebooks contain tutorials and examples designed to facilitate engagement with library collections data available in Colenda, while learning about Python as a tool for data manipulation. These notebooks can be accessed in your browser by selecting the Binder versions, or by downloading the repository onto your computer.
While leading the Collections as Data Working Group, one of the things that was highlighted across peer institutions were guides and tutorials for working with collections as data. Open-access to cultural heritage and having library data collections available for use are extremely important. However, those points are only valuable if you know how to work with data.
Given that Penn already has a wealth of digital collections, I wanted to think about how we in RDDS could make the connection to teach people about working with data from within the libraries. I was inspired by the GLAM Workbench, a project launched by Tim Sherratt for supporting people's explorations through digital gallery, library, archive, and museum (GLAM) collections. I admired Sherratt's variety of tools and techniques to ask different questions of GLAM data. And I loved that these notebooks could function on their own without technical knowledge - you can immediately go to the visualizations and start talking about them, or take the time to edit the code yourself depending on the questions.
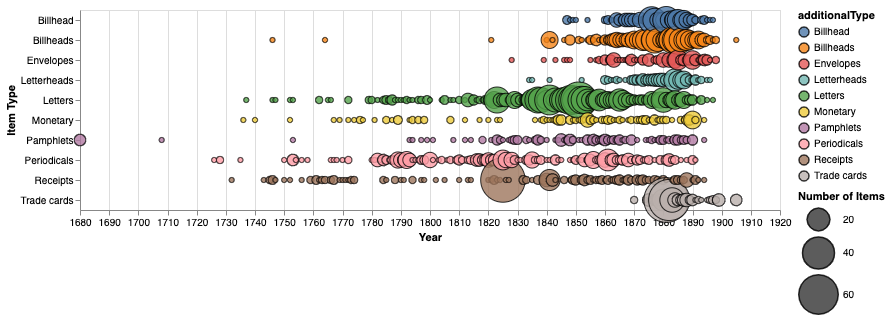
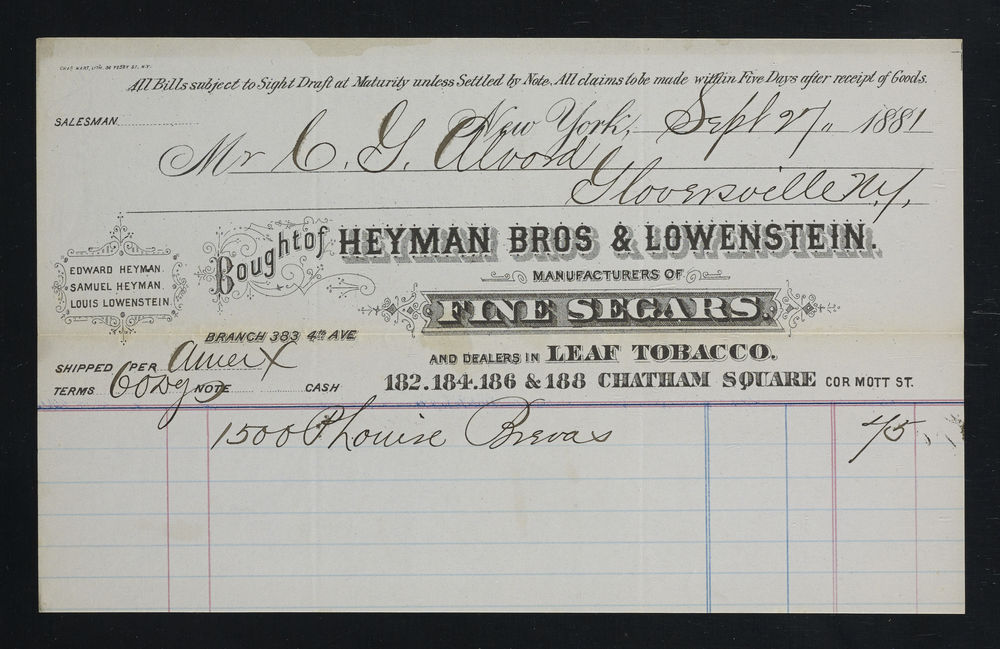
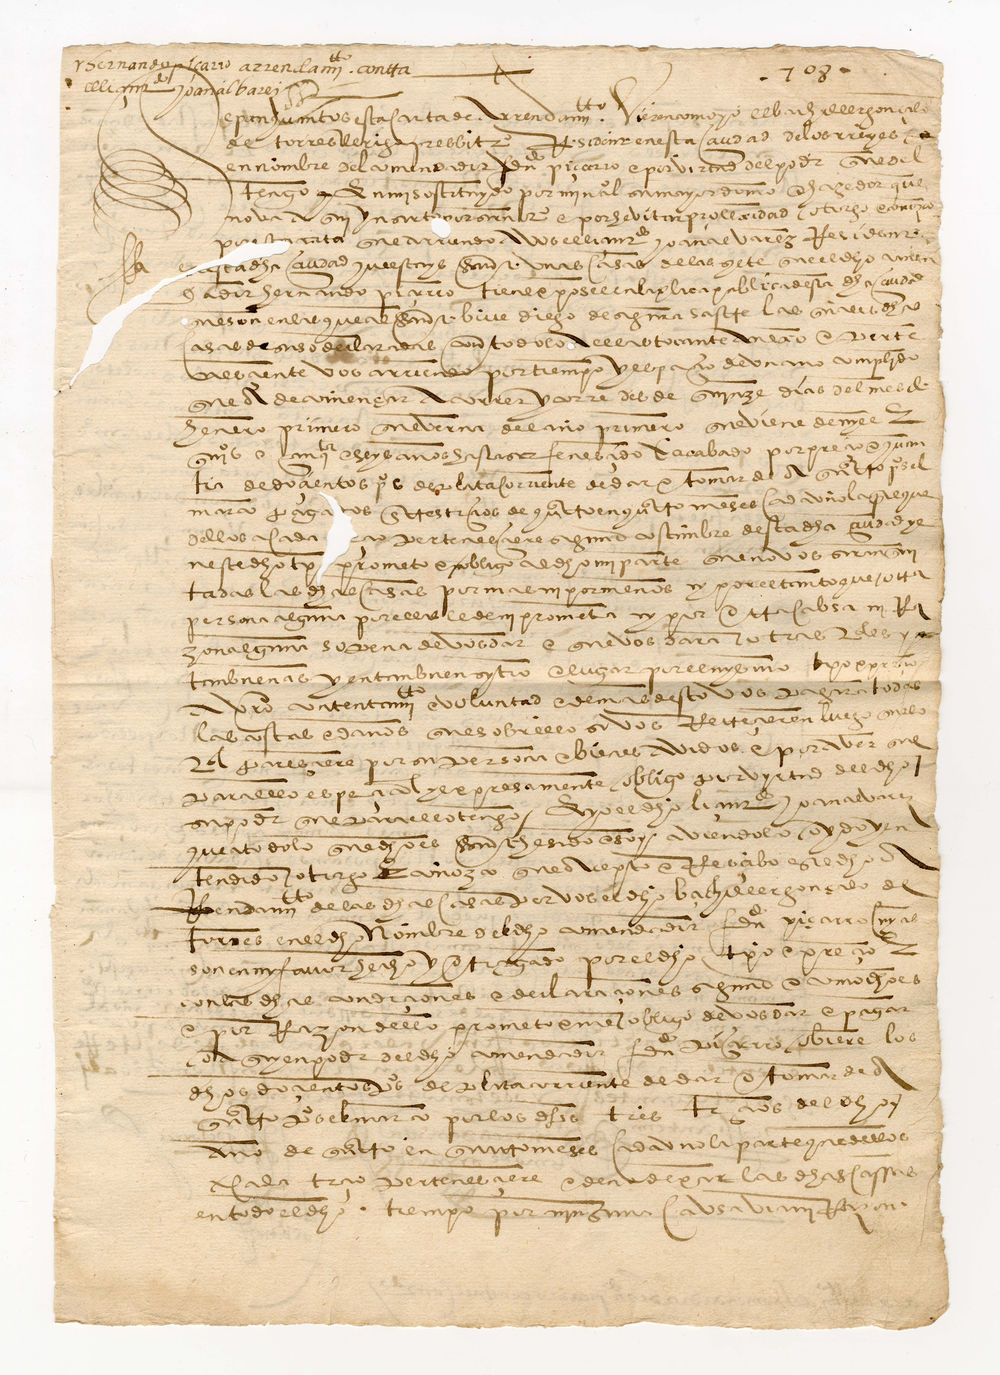
To develop my notebooks, I used Sherratt’s notebooks designed for the National Museum of Australia (NMA) as a starting point. NMA’s data is similarly structured to that available from Colenda, and Sheratt’s notebooks asked three questions of that data I felt were interesting and similar to the kinds of requests we get in RDDS: basic graphs, timelines, and maps. In addition to making some fun visualizations (have you ever seen a bubble timeline before?), I wanted these to answer real questions someone might have about this data. Particularly for the Kaplan Collection, which I used as the test dataset for these notebooks, the conception of time and space are important to understanding the collection. What does “Early American” refer to in spatial and temporal dimensions for this particular collection? How is the collector's journey reflected in the various formats, locations, and institutions represented in the collection? Most importantly, what does looking at this collection at a distance reveal?
I slowly worked my way through Sherratt's original notebooks, making changes to the code when my test Colenda data didn't work as expected or where I was unsure of what was happening. As someone who loves documentation and wanted this to be accessible to non-Python users, I added a lot of comments or explanations. I also had never worked with Altair, the Python library used for the bulk of the visualizations, before - so there was a lot of learning the strengths and limitations of this particular tool. I supplemented these notebooks with code from other projects I had worked on, as well as similar GLAM Jupyter notebooks to engage with the IIIF manifests and include images inside the notebooks.
The code in these notebooks are designed to work with any Colenda data, though the text contextualizing it is specific to working with the Kaplan Collection. If you like these notebooks and want to see more types of visualizations, let me know! I'm interested in writing additional notebooks for using collections data to build network graphs, as well as expanding these tutorials to work with OPENN & other digital resources at the Libraries.
If you like working with digital collections like this, be sure to check out these other notebooks:
- National Library of Scotland's Data Foundry
- Tim Sherratt's GLAM Workbench
- Library of Congress’s Tutorials
Thank you to the RDDS team and Kevin Thomas for their feedback on these notebooks during development!